The European Election is coming up and for the first time, I have the impression this election is actually talked about and might have an impact. I don’t remember people caring that much about European Elections in the years before, but this, of course, could also just be because I got more interested in European politics. Unfortunately, European politics are complex and this is also mirrored in the quantity of parties that are up for vote in Germany. In Germany alone, there are 40 parties on the ballot paper and in total 1.380 candidates are trying to get one of the 96 seats allocated for Germany. No joke, my ballot paper is almost as long as I’m tall! Reading through some of the names on the ballot paper, I thought it might be interesting to do a small exploratory data analysis and to compare some of the parties regarding their candidate composition.
Conveniently, the data is provided by the government in a CSV-file. Almost all parties have the same candidate list for all of Germany, the only party that has differing lists for each state is CDU/CSU. Depending on the analysis, I sometimes collapse CDU and CSU to a single party or only consider their list for Berlin.
How many candidates are in a party?
While the ballot paper only shows the top ten candidates for each party (or less if the party has less), many of them have more candidates. Interestingly, some parties have surprisingly many:
df %>%
  group_by(party) %>%
  summarise(n=n(),
            isReplacement = sum(Kennzeichen == "Ersatzbewerber")) %>%
filter(n >= 96) %>% arrange(-n) %>% kable()| party | n | isReplacement |
|---|---|---|
| CDU | 200 | 20 |
| FDP | 168 | 0 |
| SPD | 152 | 56 |
| Die PARTEI | 143 | 0 |
| ÖDP | 96 | 0 |
The FDP (democratic liberal party) and the CDU (Christian democratic union) nominate both almost twice as many candidates as there are seats available! The SPD (social democratic party) only has more candidates than seats since it has many replacement candidates. Die PARTEI is a satire party, so I’m not really surprised they show up with too many candidates. ÖDP (ecological democratic party), a small party that isn’t in the Bundestag, also places quite many candidates in the election. Looking them up, I found out the ÖDP does has one seat in the current parliament. I don’t know if there are any other benefits on being on the list if they can’t be elected. Maybe for taxing or employment reason? Or there is some event in which even the list places above 96 could still become elected?
A gender-balanced parliament?
Right now, about a third of the members of the European Parliament (MEPs) are women. We can check the data on how good the chances are that the new parliament might sport more women (at least on the German seats). Since we’ve seen before that some parties have many more candidates than seats available, it might be misleading to look at all candidates. Instead, it gives a better picture to also look at only the “Spitzenkandidaten”, that is the top candidates:
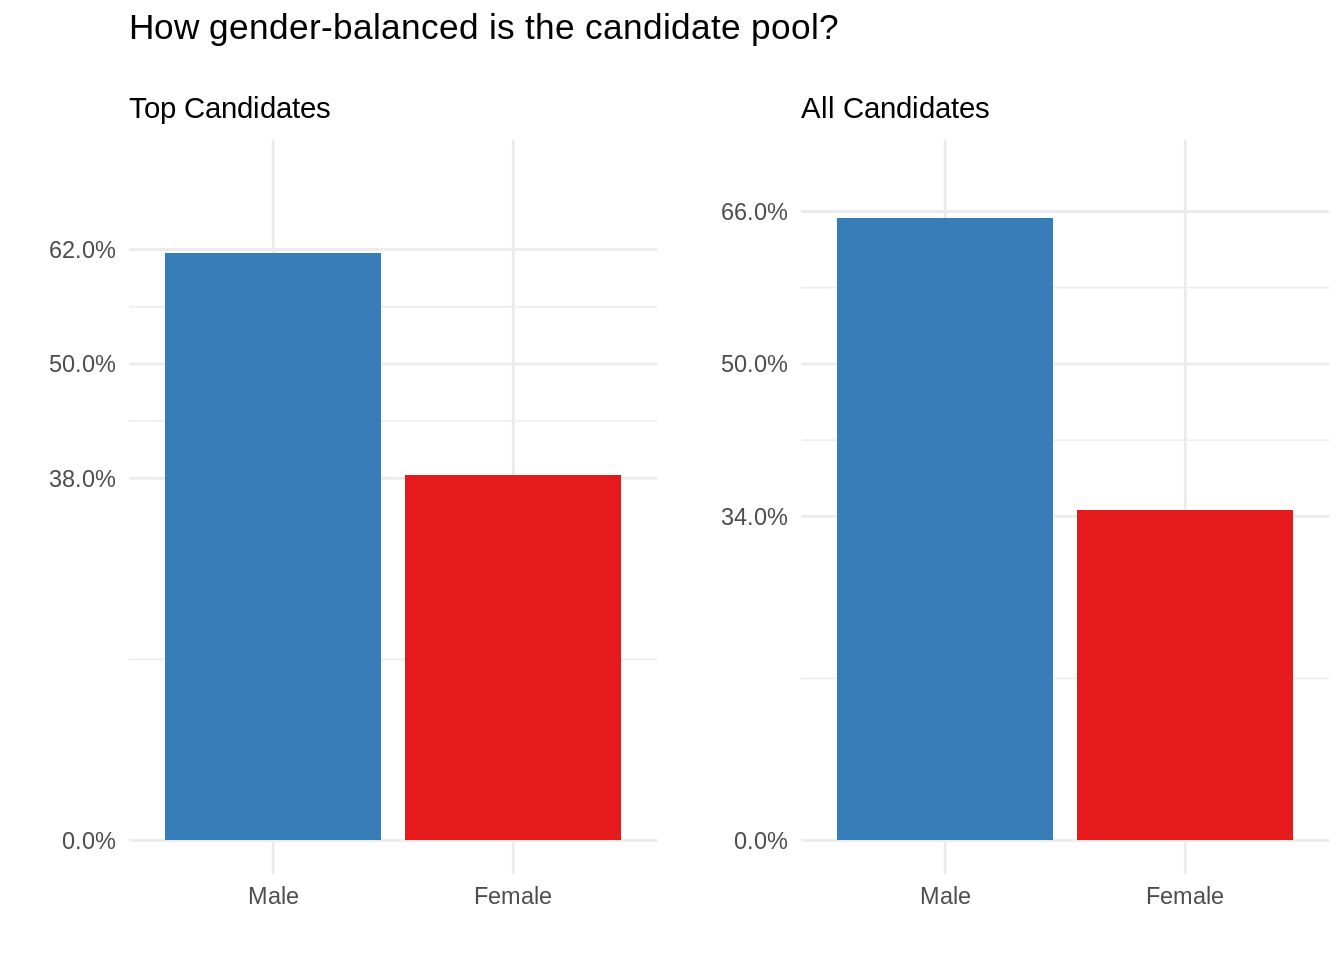
The top candidates have a slightly more equal gender-ratio but nevertheless, the gender ratio in the candidates seems the same as the ratio in the old parliament. However, there are 40 parties and all of them have 5 to 10 top candidates but the top candidates of the big party surely have better chances of entering the parliament. It is thus reasonable to look at the gender ratio for the bigger parties in particular. Since the bigger parties have good chances to get more than the top ten candidates in the parliament, we will look at the whole candidate pool for these parties. Also, I’ve pooled the parties CDU and CSU together for this plot:
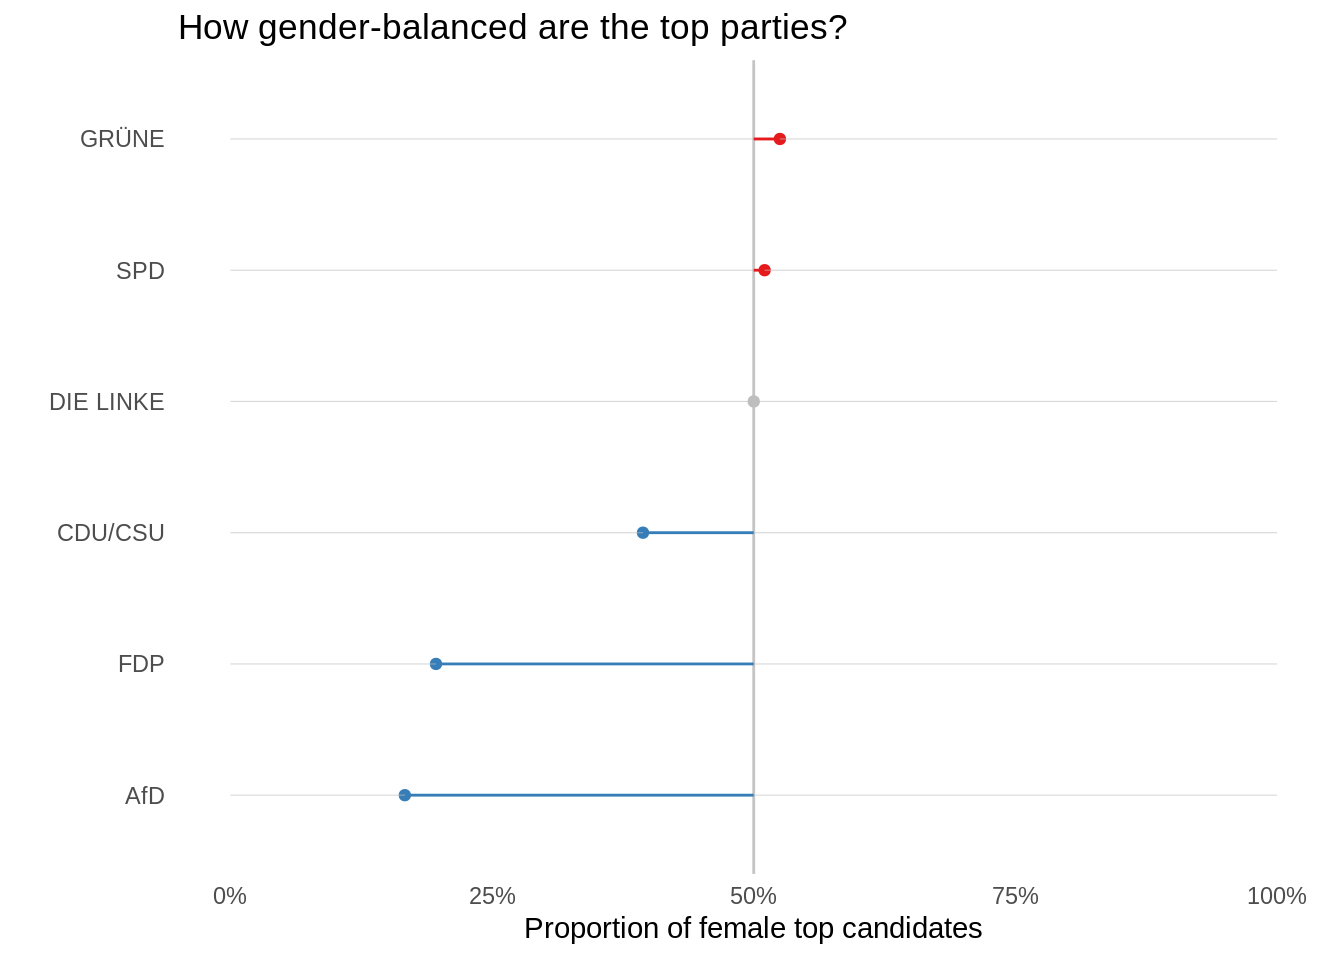
Die Linke, the left party, has exactly 50% female and male candidates, whereas the Green (GRÜNE) party and the SPD have a very slight female bias. All three parties are classified by Wikipedia as centre-left to left. The other three bigger parties, all classified as conservative by Wikipedia, have a male bias that is especially strong for the FDP and AfD. The AfD, by many considered as far-right, has been described as advocating “old gender roles”, which might contribute to their poor gender ratio. Personally, I didn’t expect FDP to do so poorly as well. I expected them to be more on the same line as CDU/CSU, around 40% of females.
Having seen the gender ratio of the six main parties, it would be interesting to check which parties show the most extreme gender ratio. I classified gender ratios as extreme if they were above 75% or below 25%.
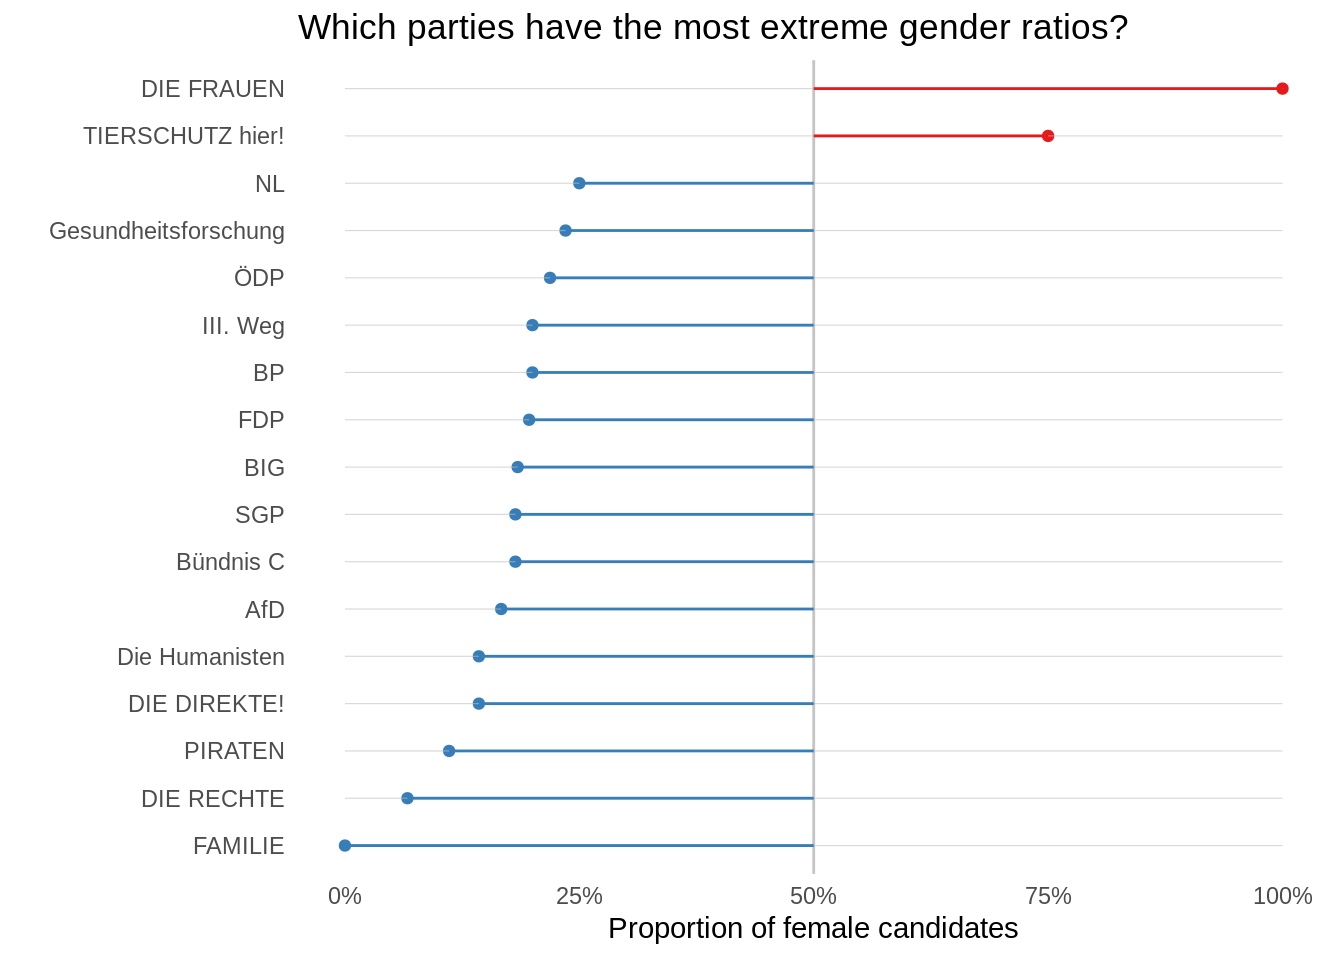
The feminist party DIE FRAUEN has only female candidates but this isn’t really surprising given their name. The only other party with a rather extreme female bias is the animal protection party TIERSCHUTZ hier!. The list of parties with an extreme male bias is comparable long: 15 parties, so more than a third of all parties on the ballot, have less than 25% female candidates. There are the parties III. Weg, AfD and DIE RECHTE (all described as right-leaning or even far-right by Wikipedia). Interestingly, the party NPD, by Wikipedia considered to be far-right and ultranationalist, is not listed here and thus has a better gender ratio than for example the FDP. The list further includes some other small conservative parties such as ÖDP, BP (Bavaria party) and Bündnis C (Christian party). I found especially curious the family party FAMILIE: no female candidates, draw your own conclusion what image they have of a family. The parties SGP (socialist equality party) and BIG (party for innovation and equity/fairness) have equality or equity in their name but it doesn’t seem to apply to gender equality. The internet party PIRATEN and DIE HUMANISTEN (the humanist party) are both described by Wikipedia as progressive but still seem to be rather male based so this is not just an issue of conservative or right parties.
What professional background do the candidates have?
The data provides the title (doctor or professor title) of each candidate so we can easily check which party has the highest percentage of candidates with a doctorate:
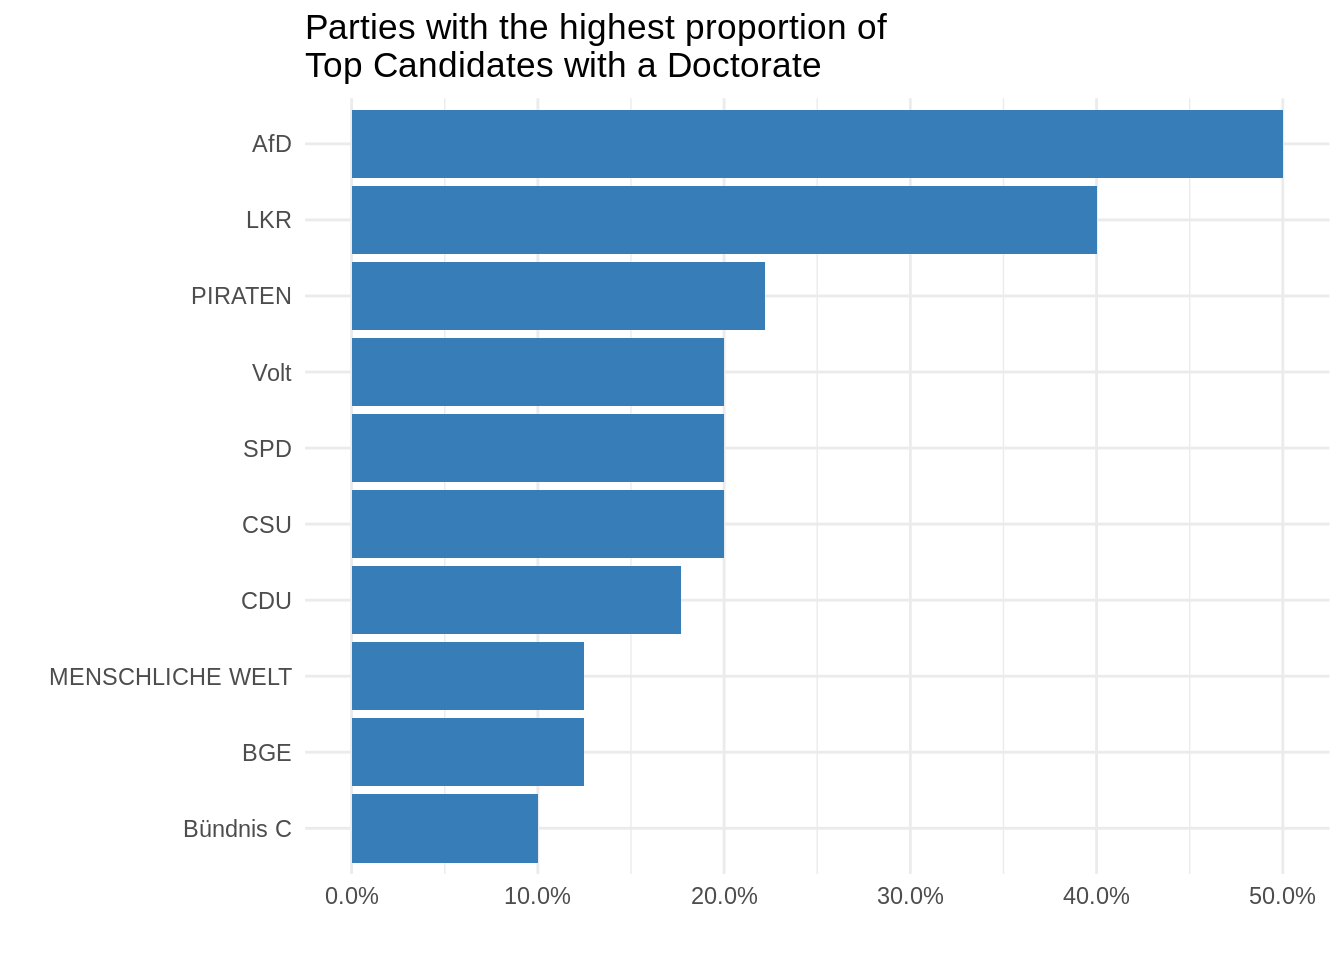
The AfD has with 50% the highest percentage of doctorates among the candidates, followed by the party LKR (liberal conservative reformers), which is actually a split from the AfD. Overall, 8.5% of all candidates have a doctoral degree, while in the general population only about 8% have even any university degree and only 1% have a doctoral degree.
While the data also provides the job title for each candidate, they’re not standardized so it would be more difficult to analyze. Luckily, on top of the job title, the data also provides us with a job key which indicates the professional area in which the candidate is working. It took me a while to find a mapping from the job index number to a description but eventually found one provided by the stats department of the Arbeitsamt.

About one-third of candidates work in Business Management and Administration which makes the single largest area of employment. One thing to note here is that the job key doesn’t provide information if someone works as a CEO or low-level employee, it really only gives the area. An interesting fact: Students is the sixth largest group, closely followed by pensioners, both of which are groups I personally didn’t expect to be that well represented in the candidate pool.
Generation change
There are a few cliches out there regarding politics and age: Young people don’t care about politics or that politicians are always old people. While this data set is not the right one to answer how much truth there is to these stereotypes, we can check how the age distribution is for the candidates:
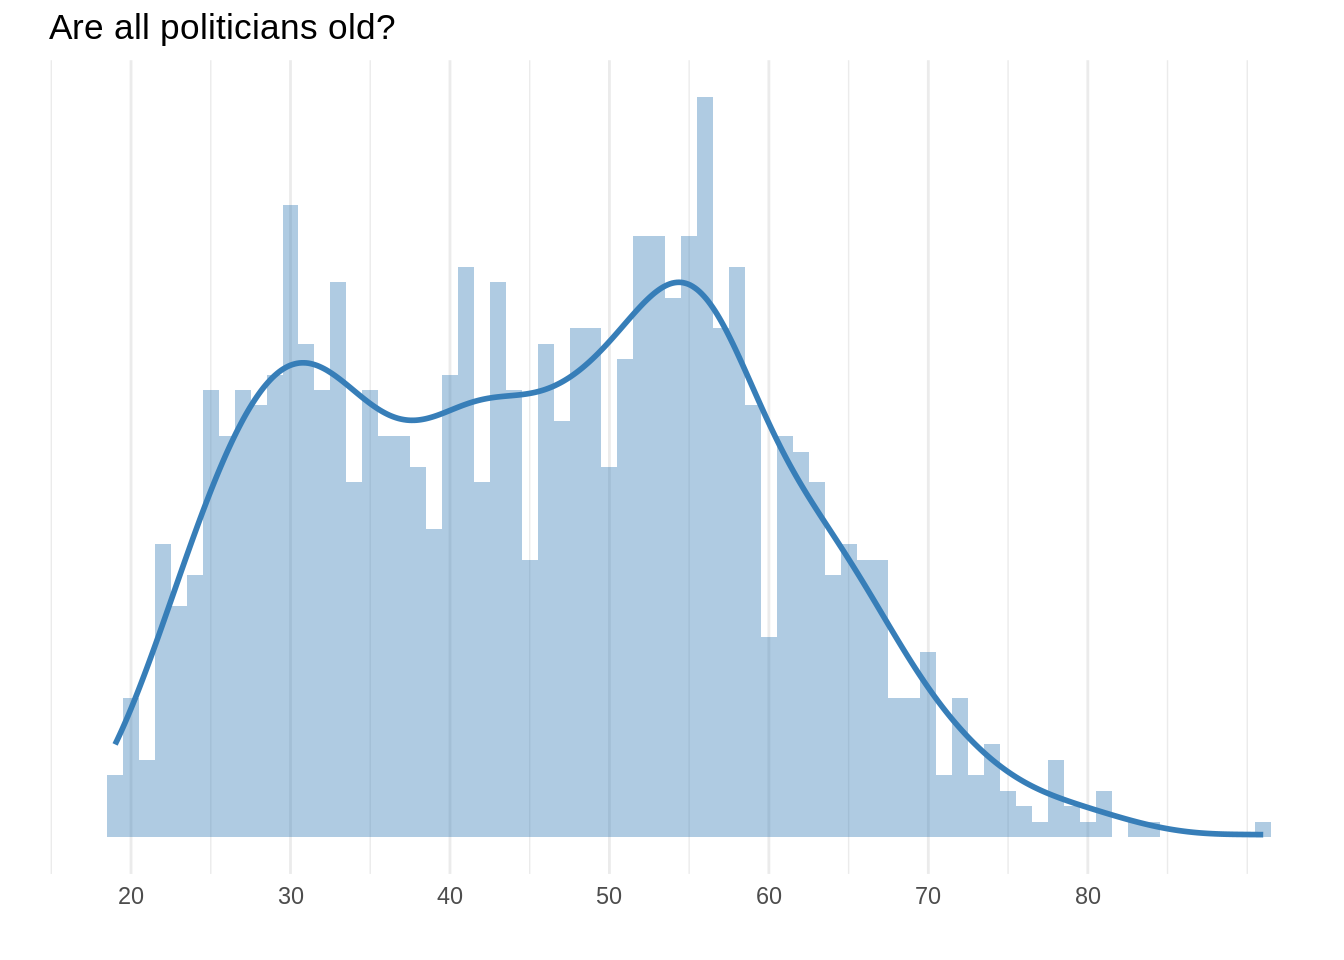
Interestingly, the age distribution is bi-modal, that is, we have a peak at 30 years old and one at 55 years old. Of course, not all candidates are elected into the parliament and most likely rookie candidates are more often delegated to later places in the list. So we shouldn’t expect the elected parliament to have a similar age distribution. But this figure is at least an indicator that young people (if you consider people around 25 still young) are interested and especially also active in politics.
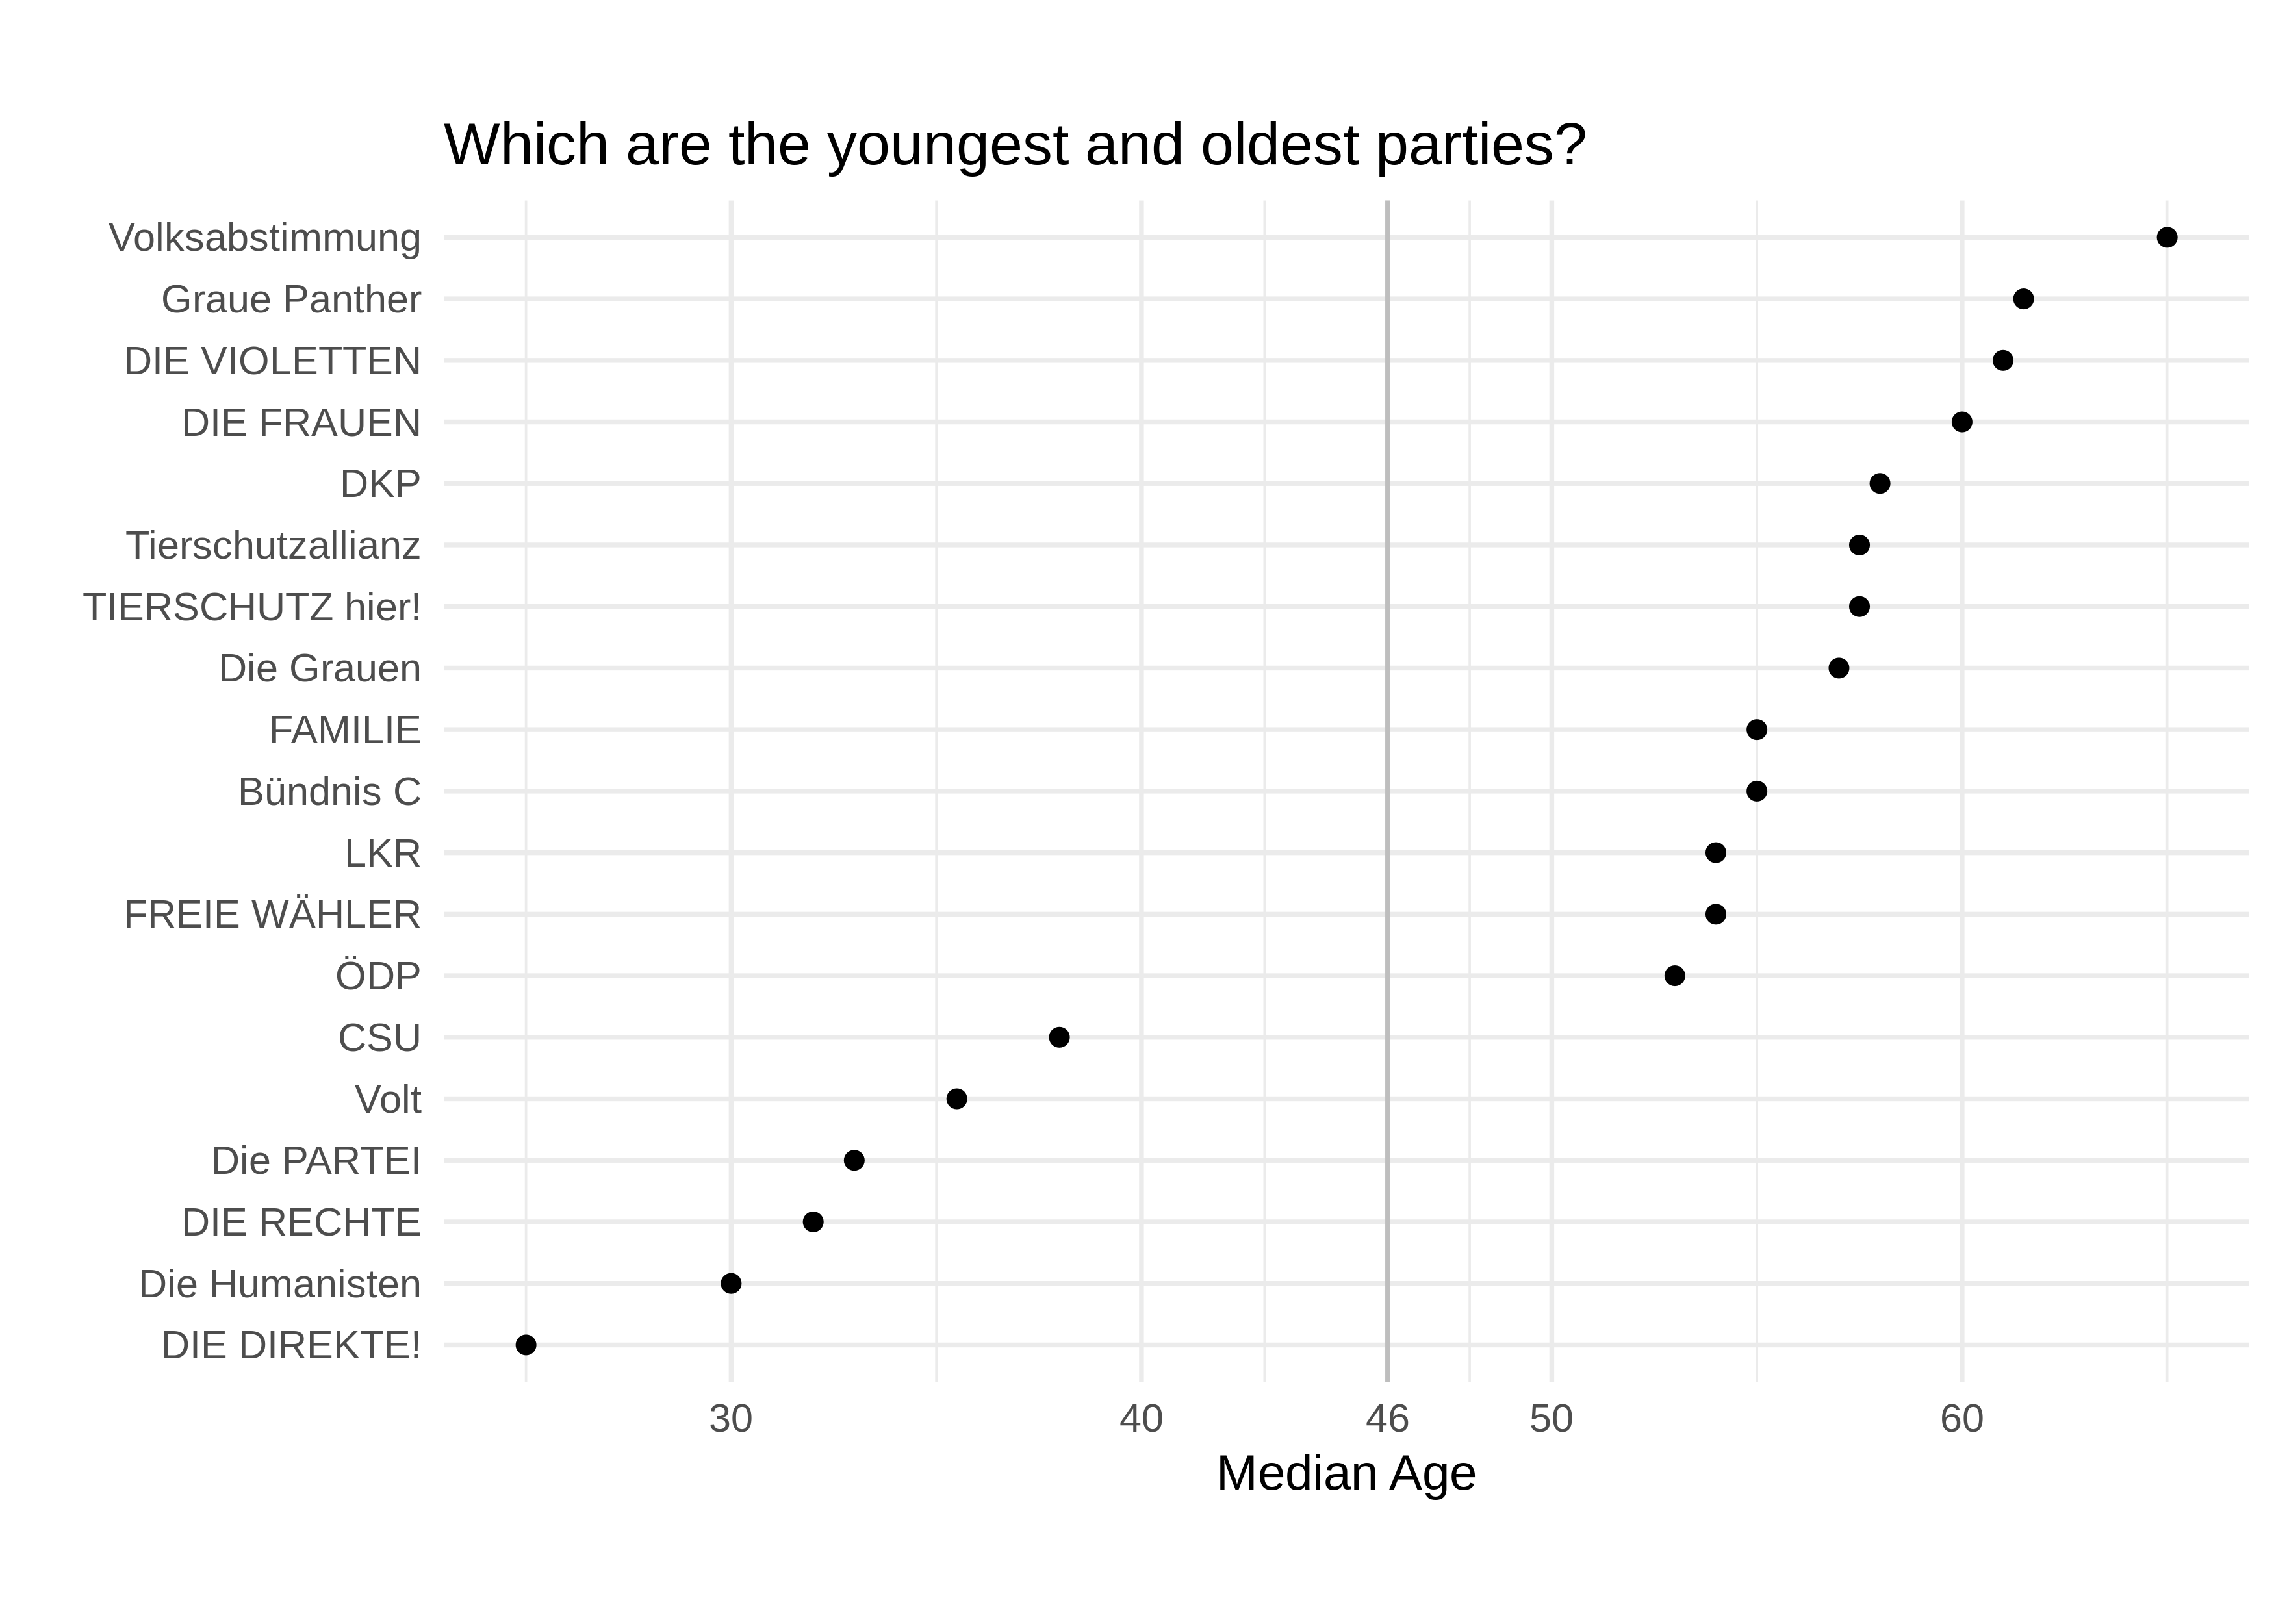
The party Volksabstimmung (Democracy by referendum, Wikipedia says they used to be far-right) has a median age of 65 years, meaning most of its candidates are older than this. It is even older than the party Graue Panther, a party for pensioners. On the other side is the party DIE DIREKTE that similarly to the party Volksabstimmung supports direct democracy (Wikipedia knows of no far-right history though) with a median age of 25. The latter party originated from a student initiative and almost all its candidates are students. Surprisingly, the conservative CSU party has a median age that places it in the younger parties, only a bit older than the new pan-European party Volt.
Where do they come from?
The data also provides us with the birthplace for each candidate which gives us the opportunity to check how many candidates were born in a country other than Germany. Unfortunately, the birthplace column only names the city but not the country. To obtain the country, I used the Google Geocoding API. Only three cities could not be identified by Google’s API which was easy to code by hand.
Not very surprisingly, most candidates were born in Germany:
df <- df %>%
  left_join(country_mapping, by=c("Geburtsort"="city"))

df%>%
  mutate(country=fct_infreq(country) %>%
           fct_lump(n=5)) %>%
  count(country) %>%
kable| country | n |
|---|---|
| Germany | 1255 |
| Turkey | 27 |
| Poland | 12 |
| Russia | 11 |
| France | 7 |
| Other | 68 |
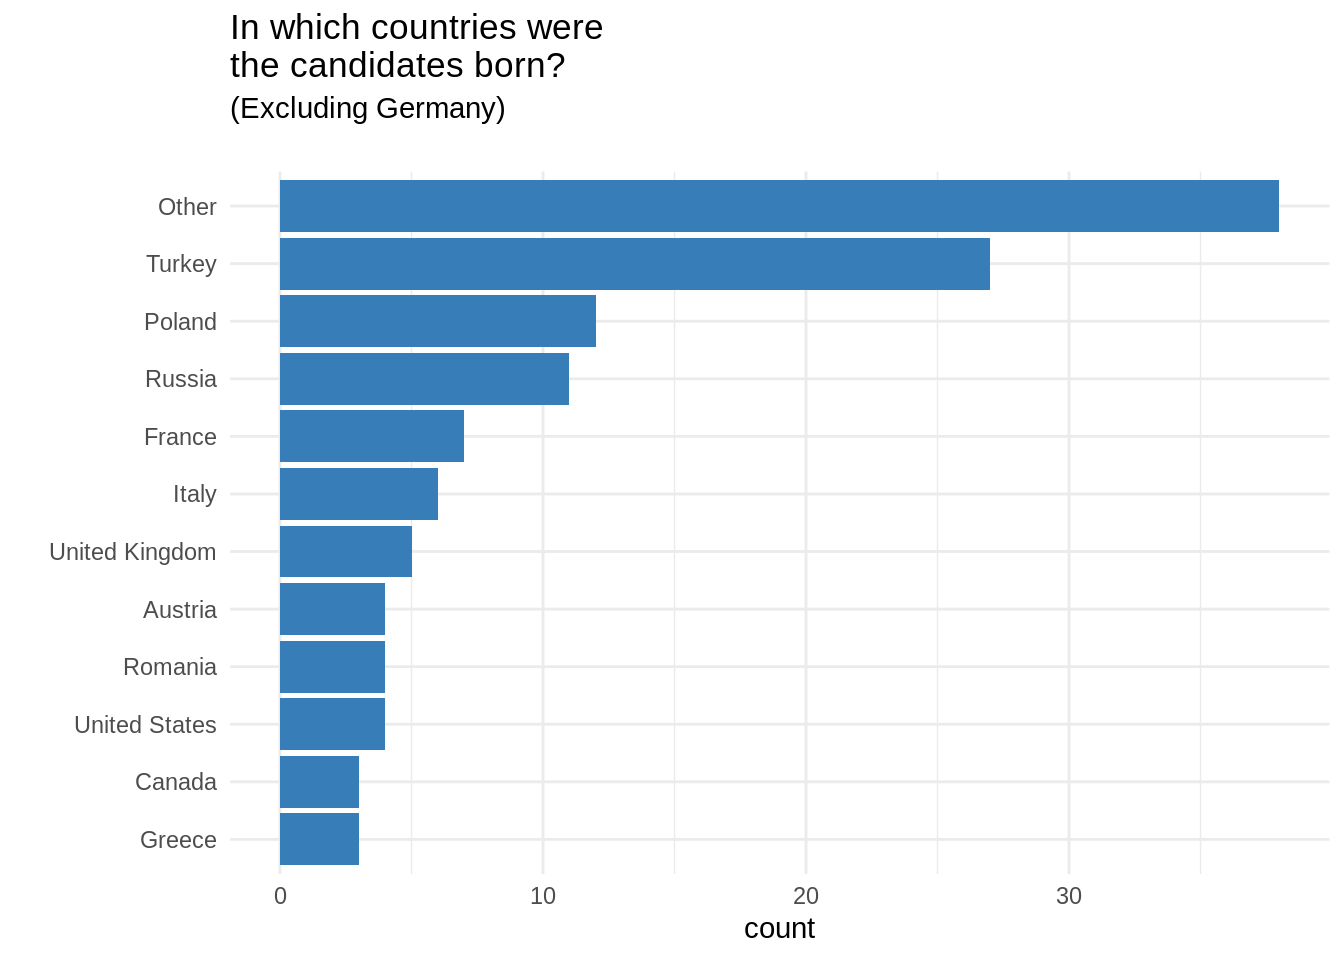
Next in line are the countries with the biggest immigrant population in Germany: Turkey, Poland and Russia. For a better comparison, I excluded Germany as country of origin from the following plot:
Now, are some parties more diverse (in terms of birthplaces of their candidates) than others or are they relatively equally distributed over the parties? Let’s compare the parties by the number of distinct birth countries. To make the comparison equal, I restrict to only the top candidates and also restrict the CDU to their top candidates in Berlin. This ensures that each party is represented by at most 10 candidates in this comparison:
| party | percentage |
|---|---|
| BIG | 60.0% |
| DiEM25 | 60.0% |
| DIE FRAUEN | 40.0% |
| SGP | 40.0% |
| DIE LINKE | 30.0% |
| MENSCHLICHE WELT | 37.5% |
BIG is one of the first parties in Germany founded by Muslims and has a particular focus on migrant politics. It thus comes as no surprise that they have such a high percentage of candidates born outside Germany.
Summary
While this data does not allow to directly analyse political ideology and party positions, some positions shine through in the data about the candidates. Especially for some of the smaller parties whose name I didn’t know before, I now have a better idea of what kind of positions or ideology they might represent. If you’re eligible for voting, I recommend you to check the positions for the parties in more detail. And of course, don’t forget to vote. The full code for this analysis (plus data) can be found here.